Today I wanted to take a moment and share some experience when it comes to debugging an Umbraco app. There is basicly three things I use the most
1. Process debugging with Visual Studio
1. Process debugging with Visual Studio
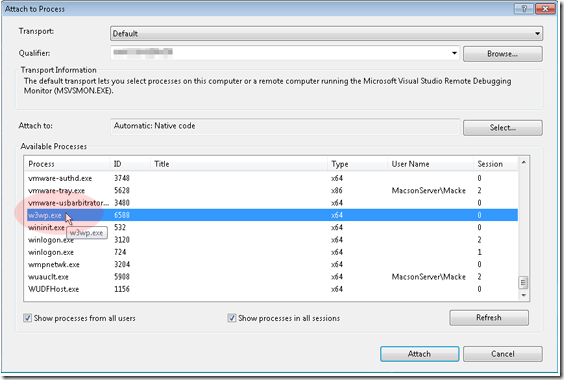
I usually have all my macros and custom user controls inside a Visual Studio project and use IIS as the web server. To debug, just go to the Tools menu and click "Attach to process". In the list choose "w3wp.exe" and Visual Studio will debug the app. You can set breakpoints, step over code and so on. If there is an exception in the code this will be shown in Visual Studio as well.
The log table in the database is a goldmine when it comes to debugging! Almost all exceptions that are thrown will show in this table. If you are having problems with macros, a package or something that runs "inside" Umbraco looking in this table will probably help you.
There is also a great tool called "F.A.L.M. Housekeeping" that can help you to view this table without having to dig into the db.
The package can be found here: http://our.umbraco.org/projects/backoffice-extensions/falm-housekeeping
If you are running your site in debug mode, you can add a “magic query string” to the url to show debug information inside the rendered page.
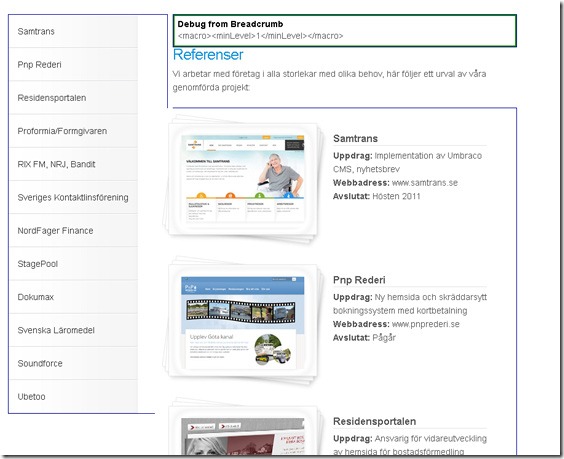
If you want to se all the macro containers just add ?umbDebug=true to the end of the url.
/yada.aspx?umbDebug=true
And if you would like to se the trace information for the page, add ?umbDebugShowTrace=true.
/yada.aspx?umbDebugShowTrace=true
One thing that is very important when putting the site into production is to disable the debug mode by setting the "umbracoDebugMode" to false in web.config.


